Turning Event Data Into Actionable Insights
Real spend behavior, SKU performance, heatmaps, and customer patterns — how smart events use payment data to make better decisions.
EventPay Team
February 10, 2026
Cash-based events operate blind. When the event is over, you know roughly how much money came in, but you don’t know much about the how or why. Which items drove the most revenue? Where did attendees spend the most time? When did the rush happen, and did you have enough capacity?
A cashless payment system turns every transaction into a data point. The question isn’t whether you have data — it’s whether you’re using it to make better decisions.
Real Spend Behavior
Aggregate revenue numbers tell you the outcome. Spend behavior data tells you the story behind it.
With EventPay, every transaction captures who spent what, where, and when. This lets you answer questions that cash events can’t:
- How much does each attendee actually spend? Not the average — the distribution. Are most people spending $30 and a few whales spending $200? Or is spend relatively even? This shapes how you price, package, and promote.
- What’s the purchase cadence? Do attendees make one big purchase or five small ones throughout the day? This affects vendor placement, menu design, and top-up prompts.
- Where does the first dollar go? Knowing that 40% of attendees make their first purchase at the drinks booth within 15 minutes of entry tells you where to focus your best vendor placement and shortest lines.
- When do people stop spending? If spending drops off at 7 PM but the event runs until 10 PM, you have a three-hour window where something isn’t working — and now you can investigate why.
SKU-Level Performance
Revenue by vendor is useful. Revenue by item is powerful.
EventPay tracks sales at the item level, which means organizers and vendors can see exactly which products drive the business:
- Top sellers by volume and revenue — These aren’t always the same item. A $5 taco might sell 500 units while a $25 rib plate sells 80, but the rib plate generates more total revenue.
- Underperformers — Items that barely move aren’t just dead weight on the menu — they slow down ordering when attendees have too many choices. Data helps vendors streamline.
- Price sensitivity — If a vendor raises their beer from $8 to $10 and volume drops 30%, the data shows that immediately. If volume stays flat, the price increase was free money.
- Time-based trends — Maybe the cold brew sells out by 2 PM and the hot coffee doesn’t move until the evening temperature drops. Item-level timing data helps vendors plan prep and inventory.
Heatmaps and Spatial Analysis
Every EventPay transaction carries a location stamp based on which vendor processed it. This turns your venue into a real-time activity map:
During the event, organizers can see which zones are hot and which are dead. If the food court is overwhelmed but the satellite bar near Stage 2 has capacity, you can push messaging or signage to redistribute traffic.
After the event, heatmap data answers critical planning questions:
- Which vendor placements generated the most revenue per square foot?
- Were there dead zones that need better attractions or signage next year?
- Did VIP areas justify their premium pricing based on actual spend data?
- How did foot traffic flow between stages, food areas, and sponsor zones?
This spatial intelligence is one of the most underutilized advantages of cashless events. The data exists in every transaction — most platforms just don’t surface it in a useful way.
Peak Analysis
Understanding your peaks changes how you plan:
- Staffing — If you know the rush hits at 6 PM every day, you can schedule extra staff to arrive at 5:30 instead of guessing.
- Inventory — Peak-hour item velocity tells vendors exactly how much product they need staged and ready during the critical windows.
- Infrastructure — If your WiFi buckles during the 8 PM surge, you know exactly where to add capacity next year. EventPay’s offline mode handles the transactions regardless, but the data still shows you where connectivity improvements would help.
- Entertainment scheduling — Correlating spend data with your stage schedule reveals which acts drive the most vendor activity — useful intel for booking next year.
Customer Behavior and Marketing Opportunities
Payment data doesn’t just help during the event. It creates a customer profile that powers marketing before and after:
- Segmentation — Group attendees by spend level, preferred vendors, or purchase patterns. High spenders get VIP upgrade offers. First-timers get welcome-back discounts.
- Re-engagement — An attendee who loaded $100 in tokens and spent $85 is a warm lead for next year. Someone who loaded $50 and spent $12 might need a different event format.
- Sponsor value — Show sponsors exactly how many attendees visited their activation zone, what they bought nearby, and how long they stayed. This turns vague “brand exposure” into measurable ROI.
- Pricing optimization — Multi-year data shows whether price increases affect volume, which items have inelastic demand, and where you have room to improve margins.
Data Without Action Is Just Numbers
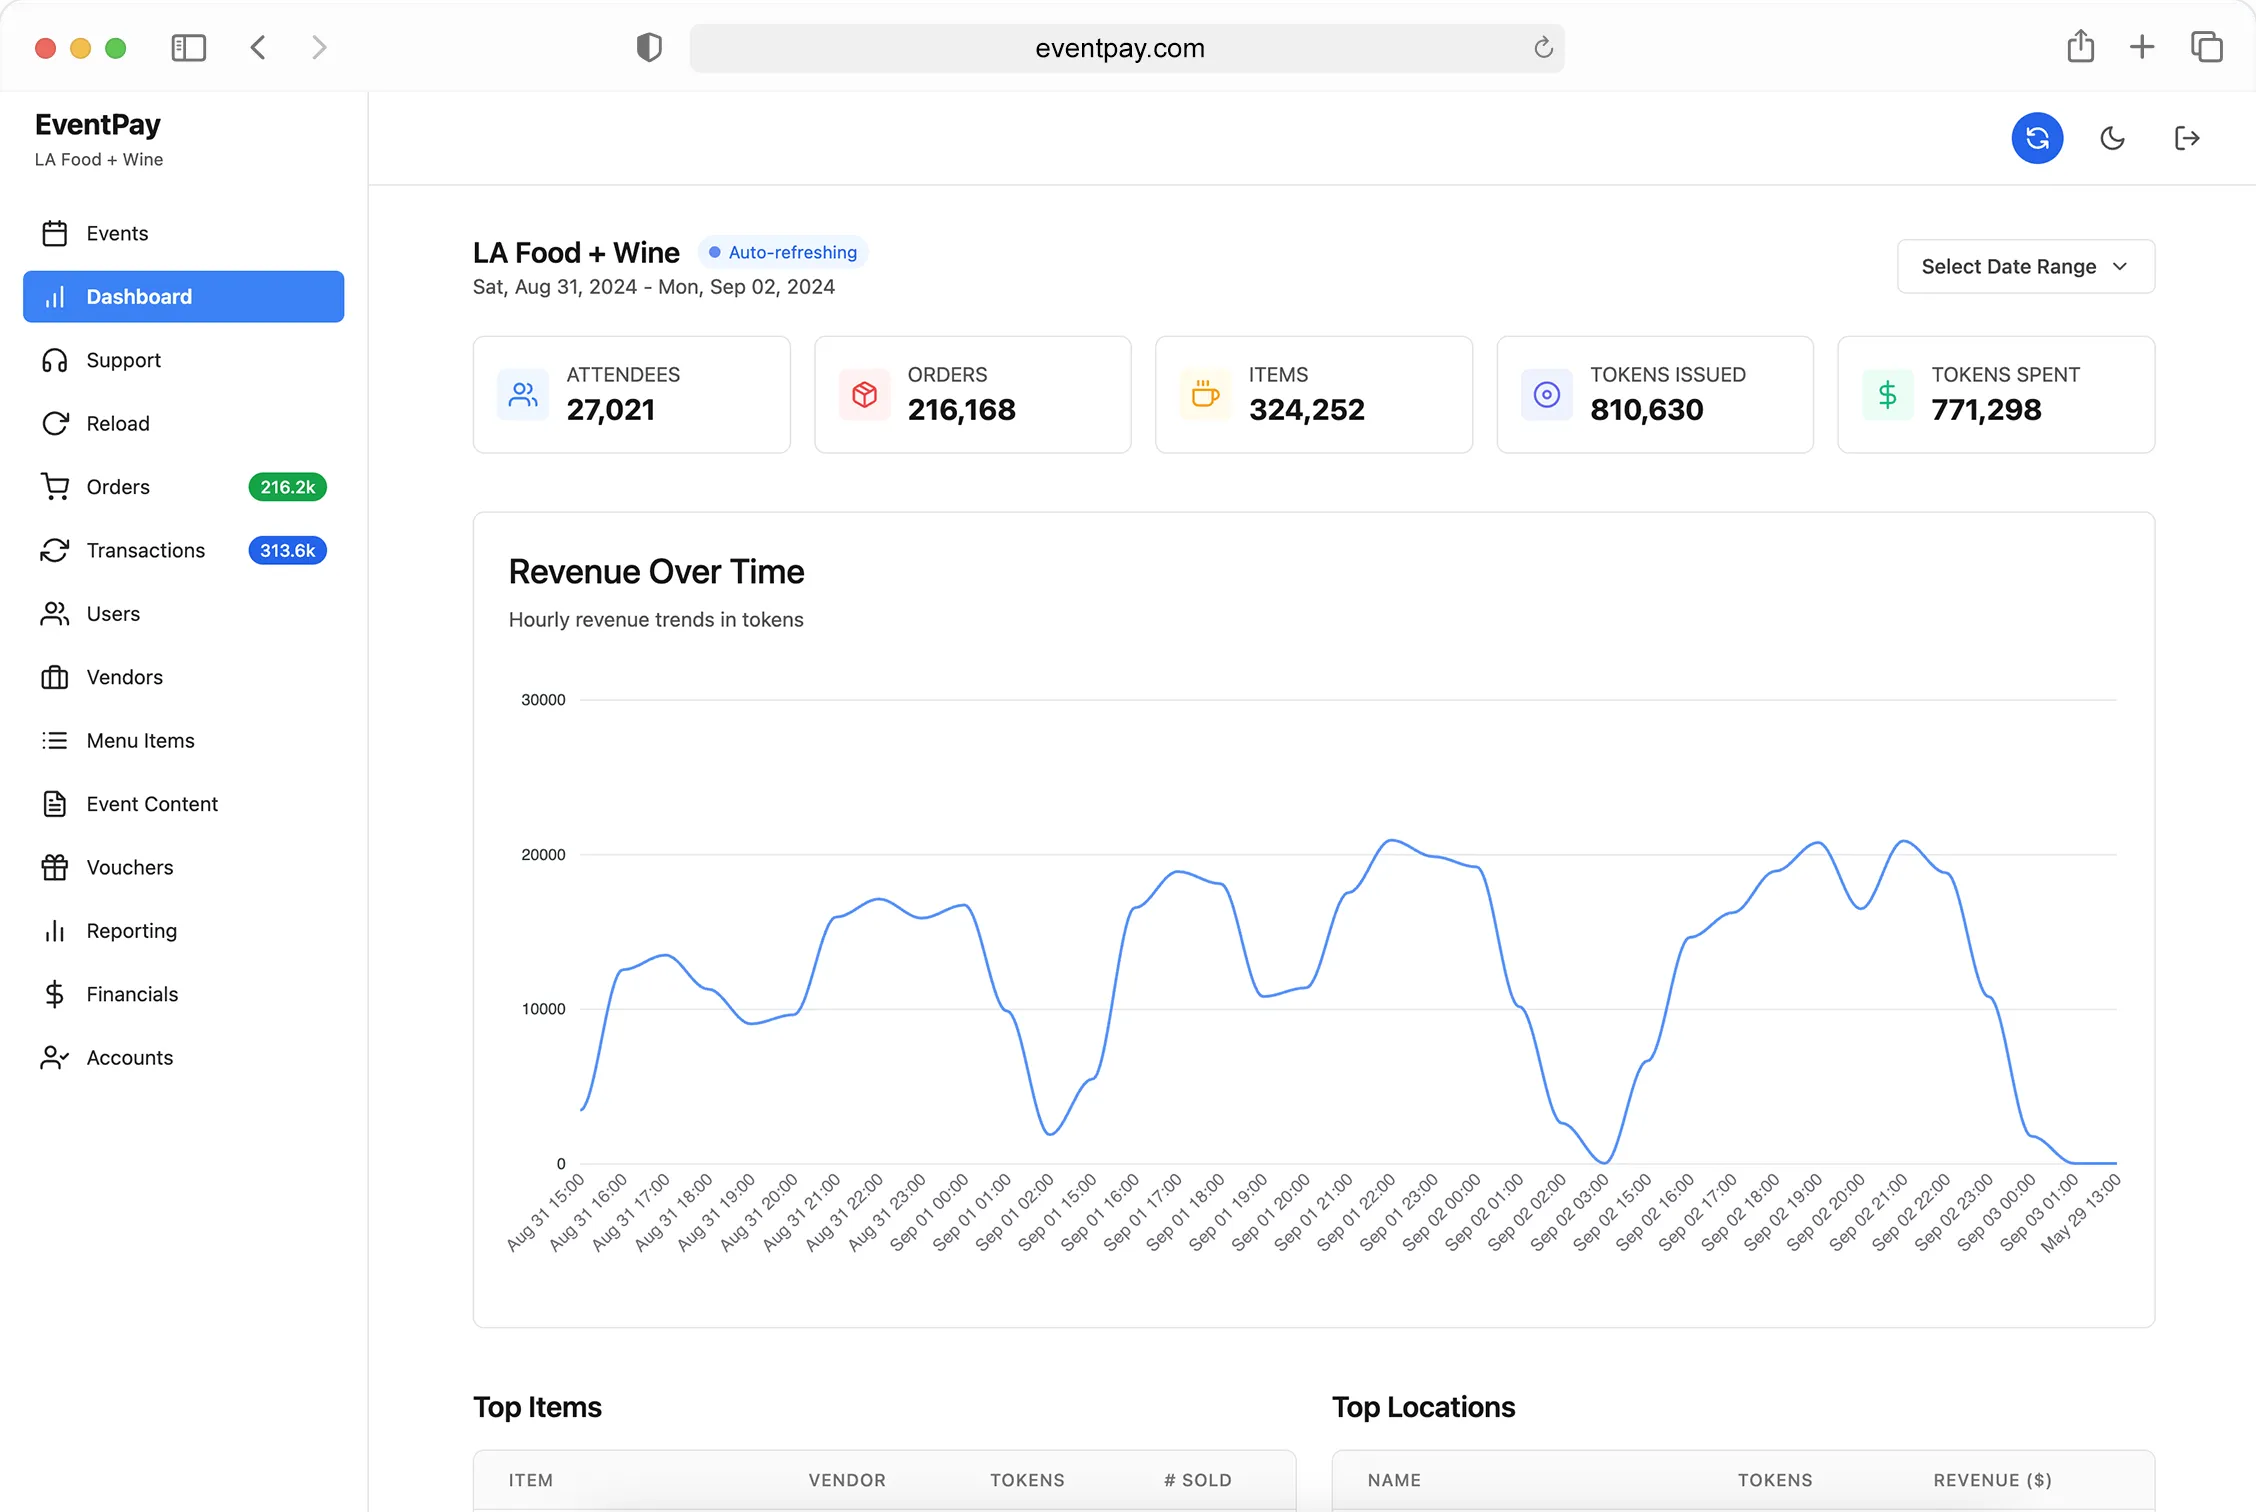
The difference between “we have data” and “we use data” is whether insights change decisions. EventPay Studio surfaces analytics in a way that’s designed for action — not just dashboards that look good in a board meeting.
Every chart, heatmap, and report is built around a decision an organizer actually needs to make: where to place vendors, how to price items, when to staff up, and which sponsors to prioritize.
The events that improve year over year are the ones that treat every edition as a dataset — and use that data to make the next one better.
Ready to see what your event data can tell you? Book a demo to explore EventPay’s analytics and reporting capabilities.