How Spatial Intelligence Helps Festival Organizers Optimize Revenue and Experience
Learn how heatmaps, customer journey tracking, and AI-powered spatial analytics help festival organizers make smarter decisions.
EventPay Team
December 8, 2025
Running a festival is part art, part logistics, and part educated guesswork. You spend months planning vendor layouts, stage placements, and foot traffic flow — but until the gates open, you’re operating on instinct and last year’s notes.
What if you could actually see how your event works? Not just the revenue numbers, but the spatial story: where attendees go, how they move, where they linger, and where they never set foot.
That’s what spatial intelligence does. And it’s changing how the best festival organizers plan, execute, and improve their events.
What Is Spatial Intelligence for Events?
Spatial intelligence is the practice of layering transaction and behavioral data onto a physical map of your event grounds. Instead of looking at spreadsheets and bar charts, you see your event as a living, breathing visualization — with hotspots, movement flows, and patterns that reveal what’s really happening on the ground.
EventPay builds this directly into the organizer dashboard through two key tools: Transaction Heatmaps and Customer Journey Tracking.
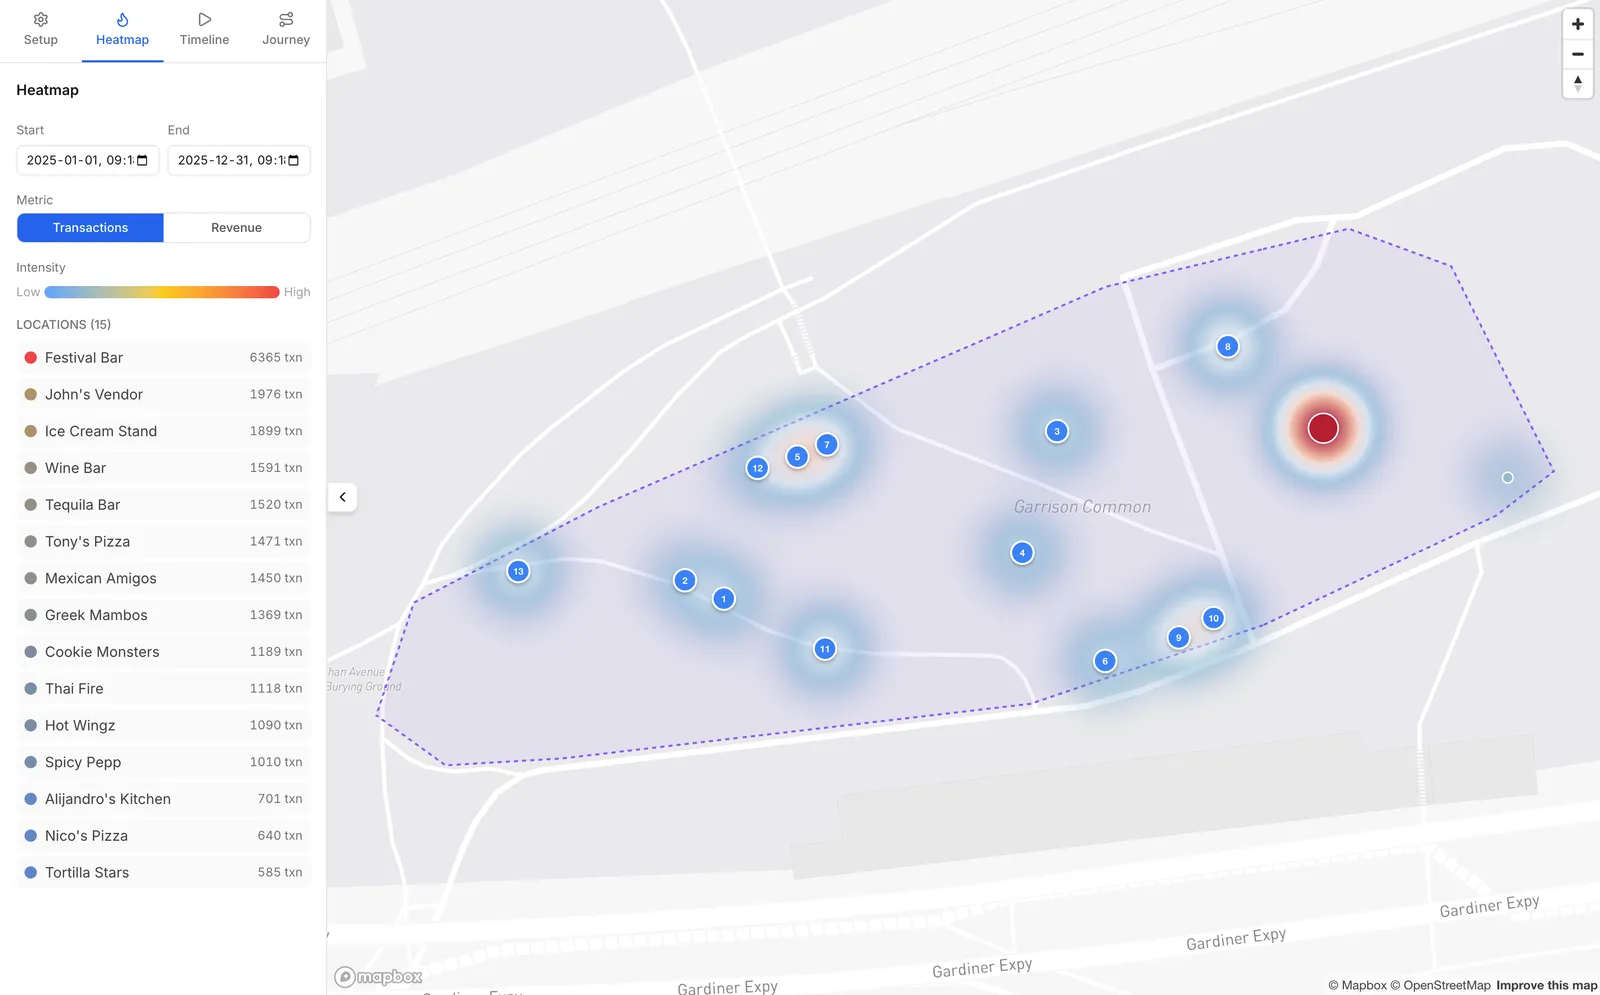
Heatmaps: Seeing Your Event From Above
EventPay’s heatmap feature overlays every transaction onto your event map in real time. Each vendor location becomes a data point, and as sales happen, the map fills with color — from cool blues in low-activity areas to intense reds where the action is concentrated.
You can toggle between two views:
- Transaction volume — Which vendors are processing the most orders?
- Revenue intensity — Where is the most money being spent?
These two views often tell different stories. A taco stand might process hundreds of small transactions while a craft cocktail bar generates more revenue per order. Seeing both patterns helps you understand your event’s economic geography.
What Heatmaps Reveal
The real power of heatmaps shows up when you start asking questions:
- Why is this corner of the event dead? Maybe the foot traffic naturally flows elsewhere, or maybe there’s a bottleneck upstream that’s diverting people.
- Why did revenue spike at 7 PM in this zone? Could be a headliner driving traffic, or a happy hour promotion — either way, you can replicate it.
- Which vendors should move next year? If a vendor is consistently in a cold zone, relocating them to a higher-traffic area benefits everyone.
Customer Journeys: Following the Attendee Path
While heatmaps show you the aggregate picture, customer journeys zoom in on the individual. You can search for any attendee and see their complete path through the event — every vendor they visited, how much they spent at each stop, and the timestamps of every transaction.
This is powerful for understanding the attendee experience beyond just what they bought. You can see:
- How attendees flow between different zones of the event
- How long they spend at each stop (dwell time)
- Their total spending and number of stops
- The sequence of their purchases — do they eat first, then drink? Or vice versa?
These individual journeys aggregate into patterns. When you look at hundreds of journeys together, you start seeing natural “paths” through your event — and you can design your layout to either reinforce or redirect them.
How AI Analyzes Spatial Data
Raw spatial data is valuable on its own. But when you layer AI analysis on top, the insights multiply. EventPay’s AI engine processes spatial data to deliver:
Predictive crowd flow modeling — Based on historical patterns and current data, predict where crowds will be in the next hour. This lets vendors prepare inventory and staff before the rush, not during it.
Anomaly detection — Get flagged when something unexpected happens. A sudden drop in transactions at a popular vendor could mean a POS issue. A rapid crowd buildup in one zone could signal a safety concern.
Post-event recommendations — After the event, AI generates a report with specific, actionable recommendations: “Move Vendor X 50 meters north to capture 30% more foot traffic” or “Add a second beverage vendor near Stage 2 — the nearest option is a 4-minute walk.”
Cross-event trend analysis — If you run multiple events, AI compares spatial patterns across all of them, identifying what’s improving and where to focus next.
Real-World Use Cases
Optimizing Vendor Placement
A food festival with 15 vendors used EventPay heatmaps to discover that three vendors in the northwest corner of the grounds were consistently underperforming — not because of their food, but because attendees entering from the main gate naturally flowed southeast. The next year, they restructured the layout to create a circular flow pattern, and overall revenue increased.
Proving Sponsor ROI
A beer festival’s title sponsor wanted data on how many attendees engaged with their branded activation zone. Customer journey data showed that the sponsor zone was visited by a significant portion of total attendees, with measurable dwell time and subsequent purchases. The sponsor renewed for multiple years based on this data.
Crowd Safety Planning
A music festival used predictive crowd flow modeling to identify a potential bottleneck between the main stage and the food court during headliner changeovers. By adding a secondary pathway and repositioning two vendors, they reduced peak congestion and improved the attendee experience.
Getting Started with Spatial Intelligence
EventPay’s spatial intelligence features are built into EventPay Studio — the organizer dashboard. There’s no additional hardware or setup required. Every transaction processed through EventPay automatically becomes a spatial data point tied to the vendor’s location on your event map.
To set up spatial intelligence for your event:
- Map your venue in EventPay Studio using the built-in setup tools
- Assign vendor locations on the map during event setup
- Watch data build in real time as transactions flow through the system
- Analyze patterns using heatmaps, customer journeys, and AI recommendations
The best part? Your spatial data persists across events. Every year gets better as the AI has more historical context to work with.
Ready to see your event from a new perspective? Book a demo and we’ll walk you through how spatial intelligence works with EventPay.